Is there a Windows version?
Yes. Version 1.3.9 for Windows 10/11 and Windows Server 2016 or newer (Desktop Experience), 64-bit, is available above as an installer, a portable EXE, or a ZIP. It has everything the Mac version has, plus the Enterprise edition. Allow it through Windows Defender Firewall on your private network the first time it starts.
Is there a Linux version?
Yes, 64-bit x86. Ubuntu, Debian and Mint can install the .deb; the AppImage or portable .tar.gz work on most modern 64-bit distributions — no install step needed for the AppImage. Same features as Windows, including Enterprise.
Two things to do after installing. Open the port on your firewall — sudo ufw allow 1514/udp && sudo ufw allow 1514/tcp, or sudo firewall-cmd --add-port=1514/udp --add-port=1514/tcp --permanent && sudo firewall-cmd --reload on Fedora and RHEL. And make sure a keyring is present: without gnome-keyring or libsecret, your licence key and SMTP password are stored as plain text, and SyslogWatch will warn you in Settings when that is the case. The .deb pulls in libsecret for you.
Does it run on a server?
Yes, and that is the expected deployment — Windows Server and Linux both. The desktop app has a window, so it needs a session to display in (a logged-in console, RDP, or a desktop environment on Linux). On a Linux server without one, use the headless mode below.
On a Linux server with no graphical session the desktop app prints Missing X server or $DISPLAY; nothing is wrong with the install. For that case the .deb and .tar.gz include a headless mode: the same receiver, rules, alerts and licence, with the same screen served to your browser. Run /opt/SyslogWatch/syslogwatch-headless; it prints the web UI address with a one-time token on 127.0.0.1 port 8514. Open it through an SSH tunnel — ssh -L 8514:127.0.0.1:8514 user@server — or an HTTPS reverse proxy, never as plain HTTP on an untrusted network. A systemd unit is installed next to it. Step by step: Run on a server without a desktop.
The window opens but stays blank
First, extract the download to a new, empty folder rather than over a previous version, and make sure no SyslogWatch process is still running while you do — a partial extraction produces exactly this symptom. Then verify the download with CertUtil -hashfile SyslogWatch-1.3.9-win.zip SHA256 against the published checksum.
If you are running 1.1.1 or 1.1.2, that is a known bug in those two releases — a stylesheet rule hid the whole interface on Windows and Linux. Update to the current version above.
On 1.1.3 or later, the app reports its own startup failures: the window shows the error, or you can open Help → Open Data Folder and send renderer.log, or press Ctrl+Shift+I and copy the Console tab. Send any of those to support@meshwatch.app.
SyslogWatch will not start on Ubuntu 24.04
Ubuntu 24.04 and later restrict unprivileged user namespaces, which Electron's sandbox relies on. If you see a message about the SUID sandbox helper, run ./syslogwatch --no-sandbox, or install the .deb instead — it sets the sandbox helper permissions during installation.
Which port does SyslogWatch listen on?
Port 1514 by default (UDP + TCP), so no administrator password is needed on either platform. You can change the port in Settings; ports below 1024 require elevated access.
Does it work with UniFi / pfSense / Synology / MikroTik?
Yes. Any device that sends RFC 3164 or RFC 5424 syslog messages works out of the box. Setup guides for the major platforms are in the Setup guides section above.
My logs are in Korean, Japanese or Chinese. Will the text display correctly?
Yes. RFC 5424 requires UTF-8, but RFC 3164 specifies no encoding at all, so most devices and Windows event-log forwarders send the operating system's code page instead — CP949 on Korean Windows, Shift_JIS on Japanese, GBK on Chinese. Tools that assume UTF-8 turn those messages into rows of ����, and the damage is permanent because the original bytes are discarded.
SyslogWatch reads each message as UTF-8 when the bytes really are UTF-8 and falls back to a code page otherwise, guessed from your system locale. A Korean or Japanese install shows the right characters on first run with nothing to configure. If your collector runs in a different language from the devices sending to it, choose the encoding under Settings → Receiving Server.
Where are my logs stored?
Only on your own computer — under Application Support on macOS, %APPDATA%\SyslogWatch\ on Windows, and ~/.config/SyslogWatch on Linux (/var/lib/syslogwatch/SyslogWatch for the headless service). Nothing is sent to MeshWatch, to advertising networks, or to any cloud account.
What does the Enterprise edition add?
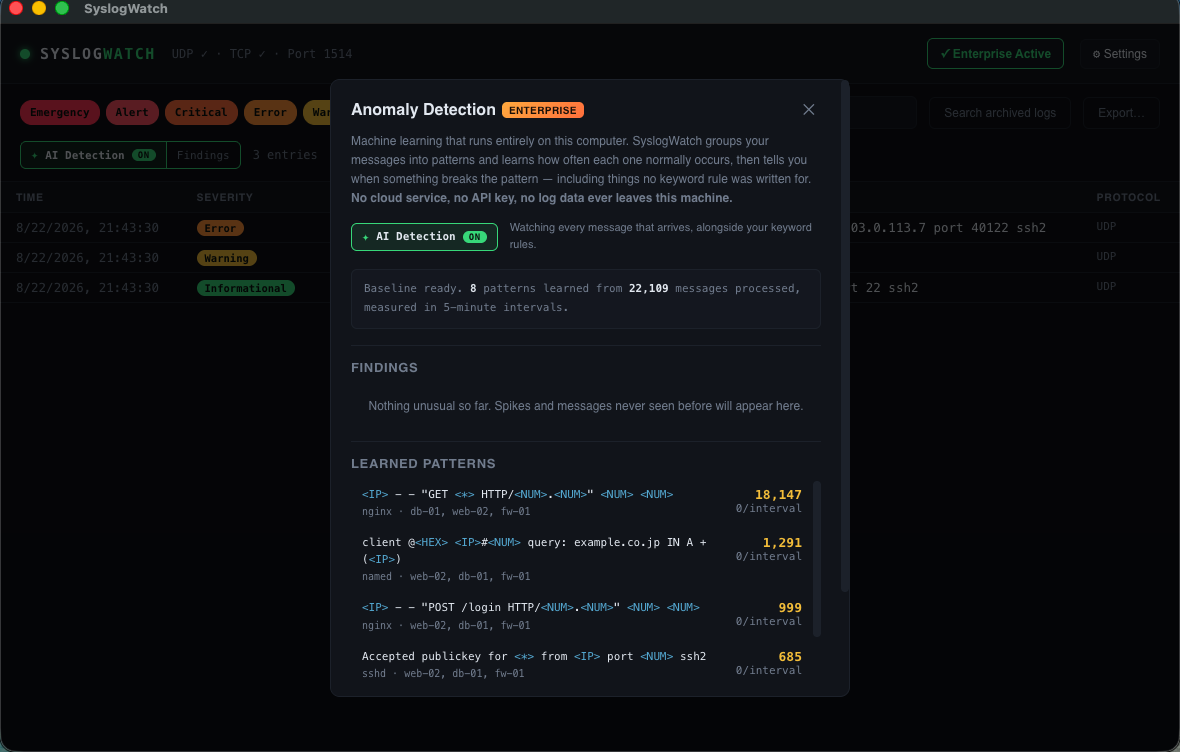
AI anomaly detection. SyslogWatch groups incoming messages into patterns and learns how often each one normally occurs, then flags sudden spikes and messages that have never been seen before — including things no keyword rule was written to catch. It runs entirely on your own machine: no cloud service, no API key, no log data ever leaves the computer.
Plus a real rule engine and the controls a fleet needs. Rules combine severity ranges, hosts, programs and facilities (with * and ? wildcards), protocol, inclusion and exclusion terms, and regular expressions — and you can test a rule against your recent logs before saving it. Alerts get rate limiting: a cooldown, an hourly cap, or a digest window that collects a burst into one email, with suppressed counts reported so a quiet inbox never hides a storm. It also adds automatic document archiving to CSV, HTML or text, log retention policies, and ruleset export so you can deploy the same policy to every machine.
Enterprise is available on Windows, Linux, and the notarised direct-download macOS build — the Mac App Store edition tops out at Pro because Apple requires in-app purchases for anything sold through the Store.
How does the AI anomaly detection work?
It builds a baseline of what "normal" looks like for your logs, then watches for deviations from it — no training data, no model download, and nothing sent anywhere. Under the hood it groups messages into templates (the way a human would notice "these are all failed SSH logins, just with different usernames") and tracks how often each template fires, measured in short time intervals.
Two kinds of findings show up: a template firing far more often than its usual rate (a spike — useful for catching things like a brute-force attempt or a flapping interface generating thousands of messages), and a template that has never been seen before during the learning period (a first-time event — useful for catching a new failure mode nobody wrote a rule for). It needs a period of normal traffic to learn from before it can tell what is unusual; until a baseline is ready, findings stay off.
Is there a Mac version that skips the App Store?
Yes. The direct download above is a notarised DMG signed with a Developer ID certificate, so Gatekeeper opens it without warning — same as any other Mac app from outside the Store. Unlike the Mac App Store build, it can sell Enterprise and AI anomaly detection, because it isn't bound by Apple's in-app purchase requirement. Licensing works the same way as Windows and Linux: an annual Stripe subscription and a licence key checked locally.
Why does alert rate limiting matter?
One flapping interface can emit dozens of syslog messages a second. Without limits that becomes thousands of emails, your SMTP provider throttles the account, and the team learns to ignore the alerts entirely. Enterprise rules let you cap how often a rule may mail you, or collect a burst into a single digest — and the count of held-back events travels with the next message, so you still see the real scale.
What is the difference between free and Pro?
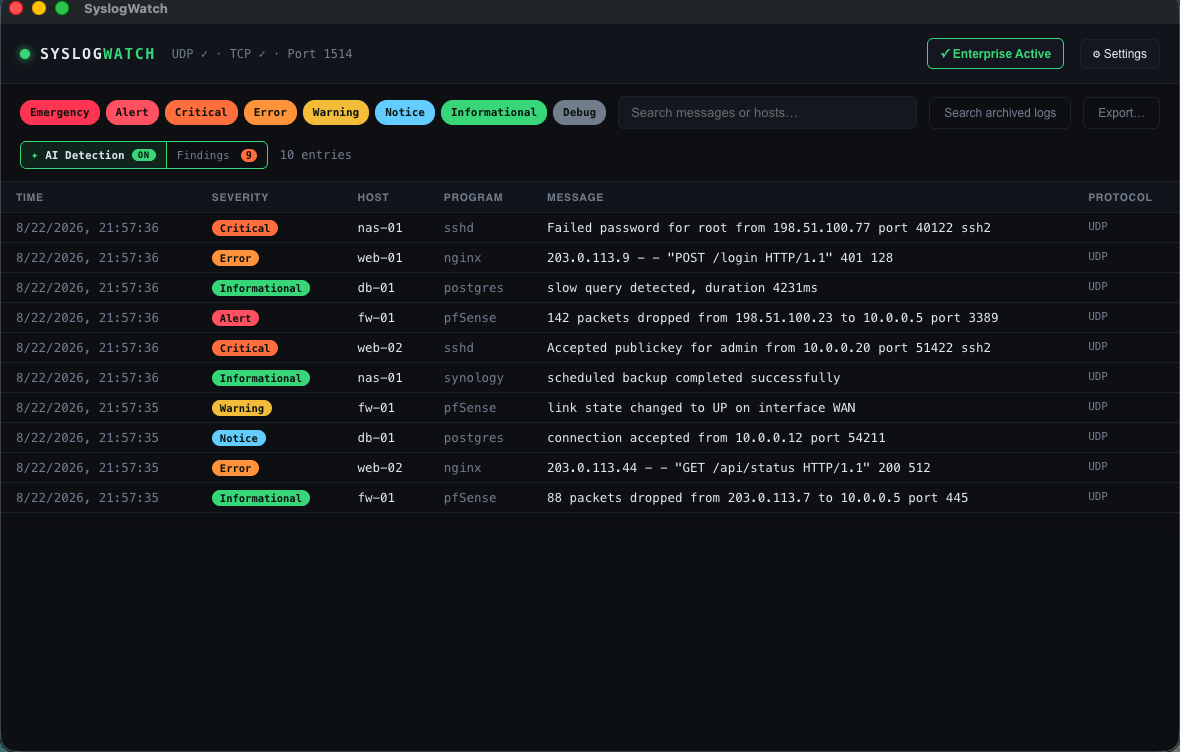
Free covers live receiving, filtering, and up to 3 alert rules. Pro adds full-text search across the stored archive, up to 50 alert rules, email notifications via your own SMTP, multi-host view, and CSV/JSON export. Unlimited alert rules are an Enterprise feature.
Do I need a paid subscription to try it?
No. The free tier is fully usable, and it does not cap how much it receives or stores — every message your devices send is written to disk regardless of edition. Pro is useful when you need to search that archive, more than 3 alert rules, email notifications, or CSV/JSON export.
How does Pro work on Windows?
Subscribing is US$99/year, billed through Stripe. You receive a licence key by email straight after payment (from license@meshwatch.app, usually within a minute — check your Junk or Spam folder if it is not in your inbox) — paste it into the app under Upgrade to Pro and Pro unlocks on that computer. The key carries its own expiry date and is verified locally against a key built into the app, so activation works offline and SyslogWatch never contacts a licensing server. Each year your subscription renews, a fresh key is issued and emailed automatically.
How do I cancel Pro?
Through the Mac App Store: App Store → your profile → Subscriptions → SyslogWatch Pro → Cancel. On Windows, Linux, or the direct macOS download, email support@meshwatch.app before your renewal date — the current key keeps working until its printed expiry date either way. Your free features continue to work after that.
Is there a lifetime licence?
Not currently. Subscription pricing lets us keep the app maintained across macOS releases. If a lifetime tier becomes available it will be announced here.
Does it work with MeshWatch Central?
Optionally. Connect SyslogWatch to your own MeshWatch Central server and its alerts join whatever ConfigWatch, CertWatch, DeviceWatch, TrafficWatch and TrapWatch are reporting into one shared inbox — a log burst on the same device an interface just went down on shows up as one incident, not two. SyslogWatch sends Central a one-line summary like “47 failed logins in 5 minutes on fw-01” — never the raw log lines themselves. Central is a separate product you run on your own server; SyslogWatch works exactly the same with or without it.